CityGraph: a knowledge graph of Bainbridge Island
Designed and built as sole engineer, 2025–present, for Let’s Map Bainbridge.
The problem
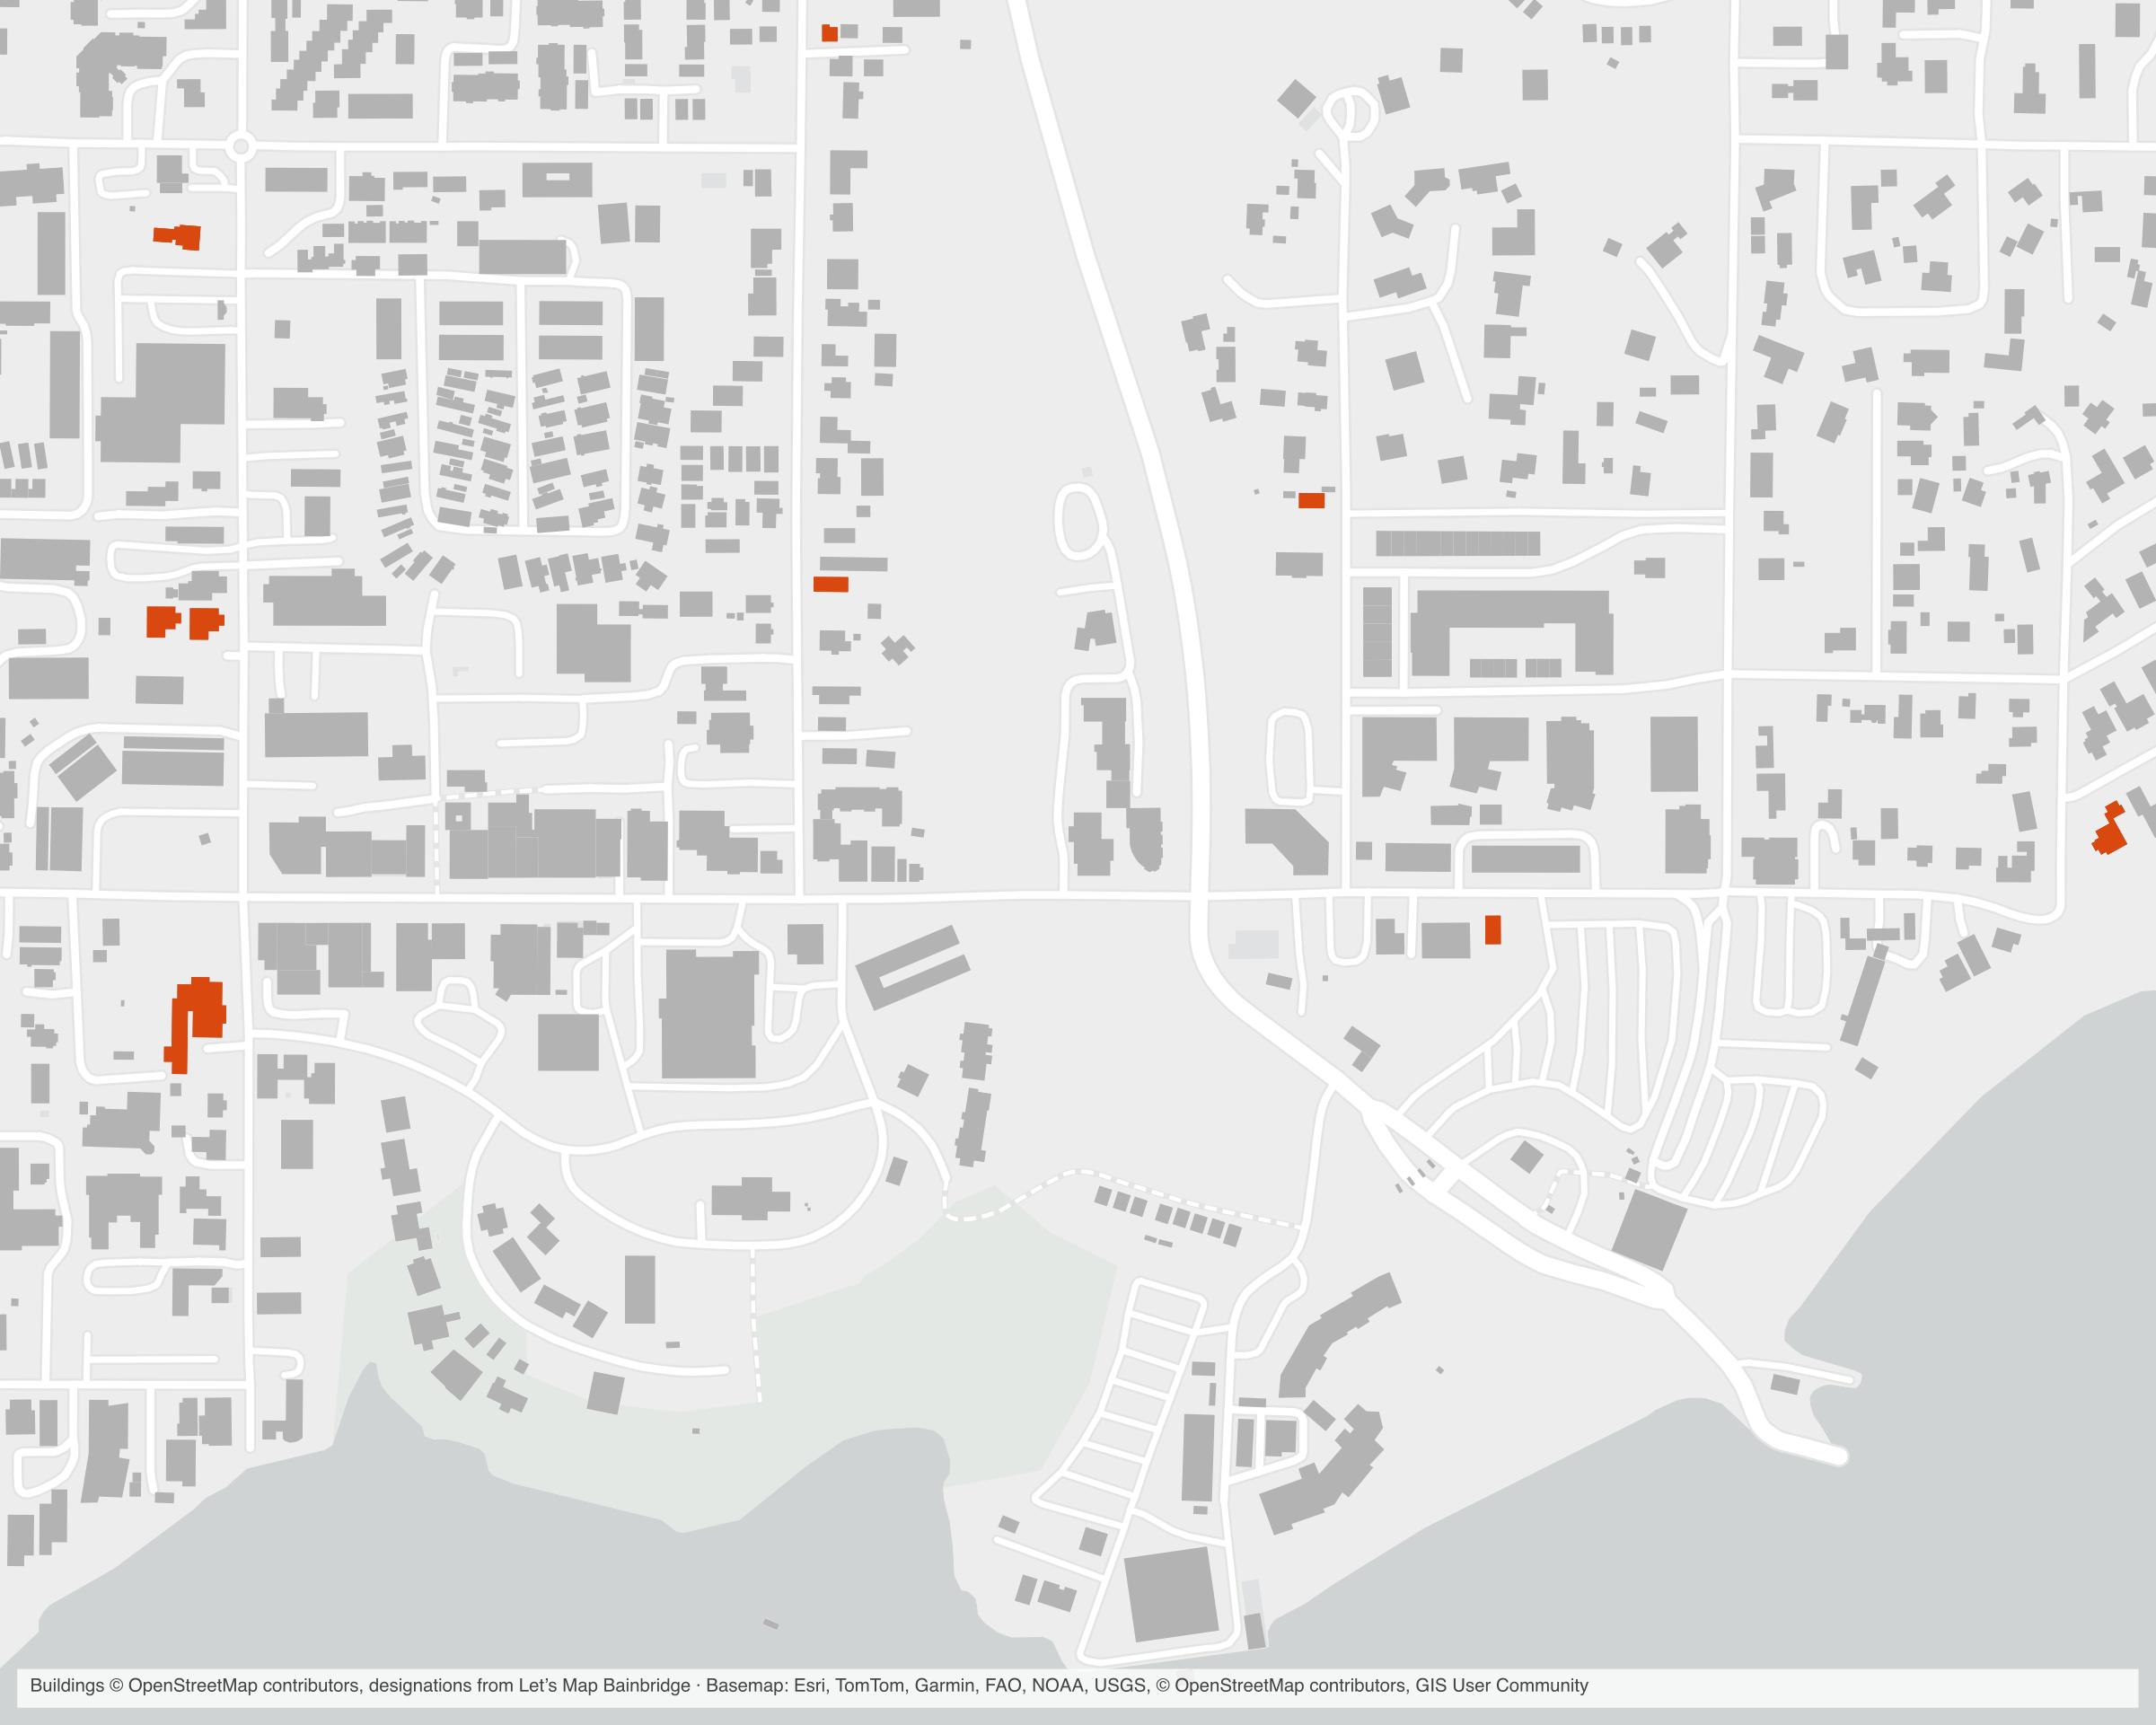
Bainbridge Island’s history is scattered. Buildings are in the City’s GIS and the state’s historic-property inventory; people and photographs are in the Bainbridge History Museum’s catalog; roads and footpaths are in OpenStreetMap; and much of the rest is in old books, maps and the heads of long-time residents. None of these sources knows about the others, and none of them handles change over time: a building that was a store, then a church, then a house; a ferry with three names; a landing that no longer exists.
I wanted one place where all of that could be linked, checked and explored: a map that knows its own history.
What I built
CityGraph is the platform underneath Let’s Map Bainbridge. I designed and built it as sole engineer over ten months, working with Claude Code.
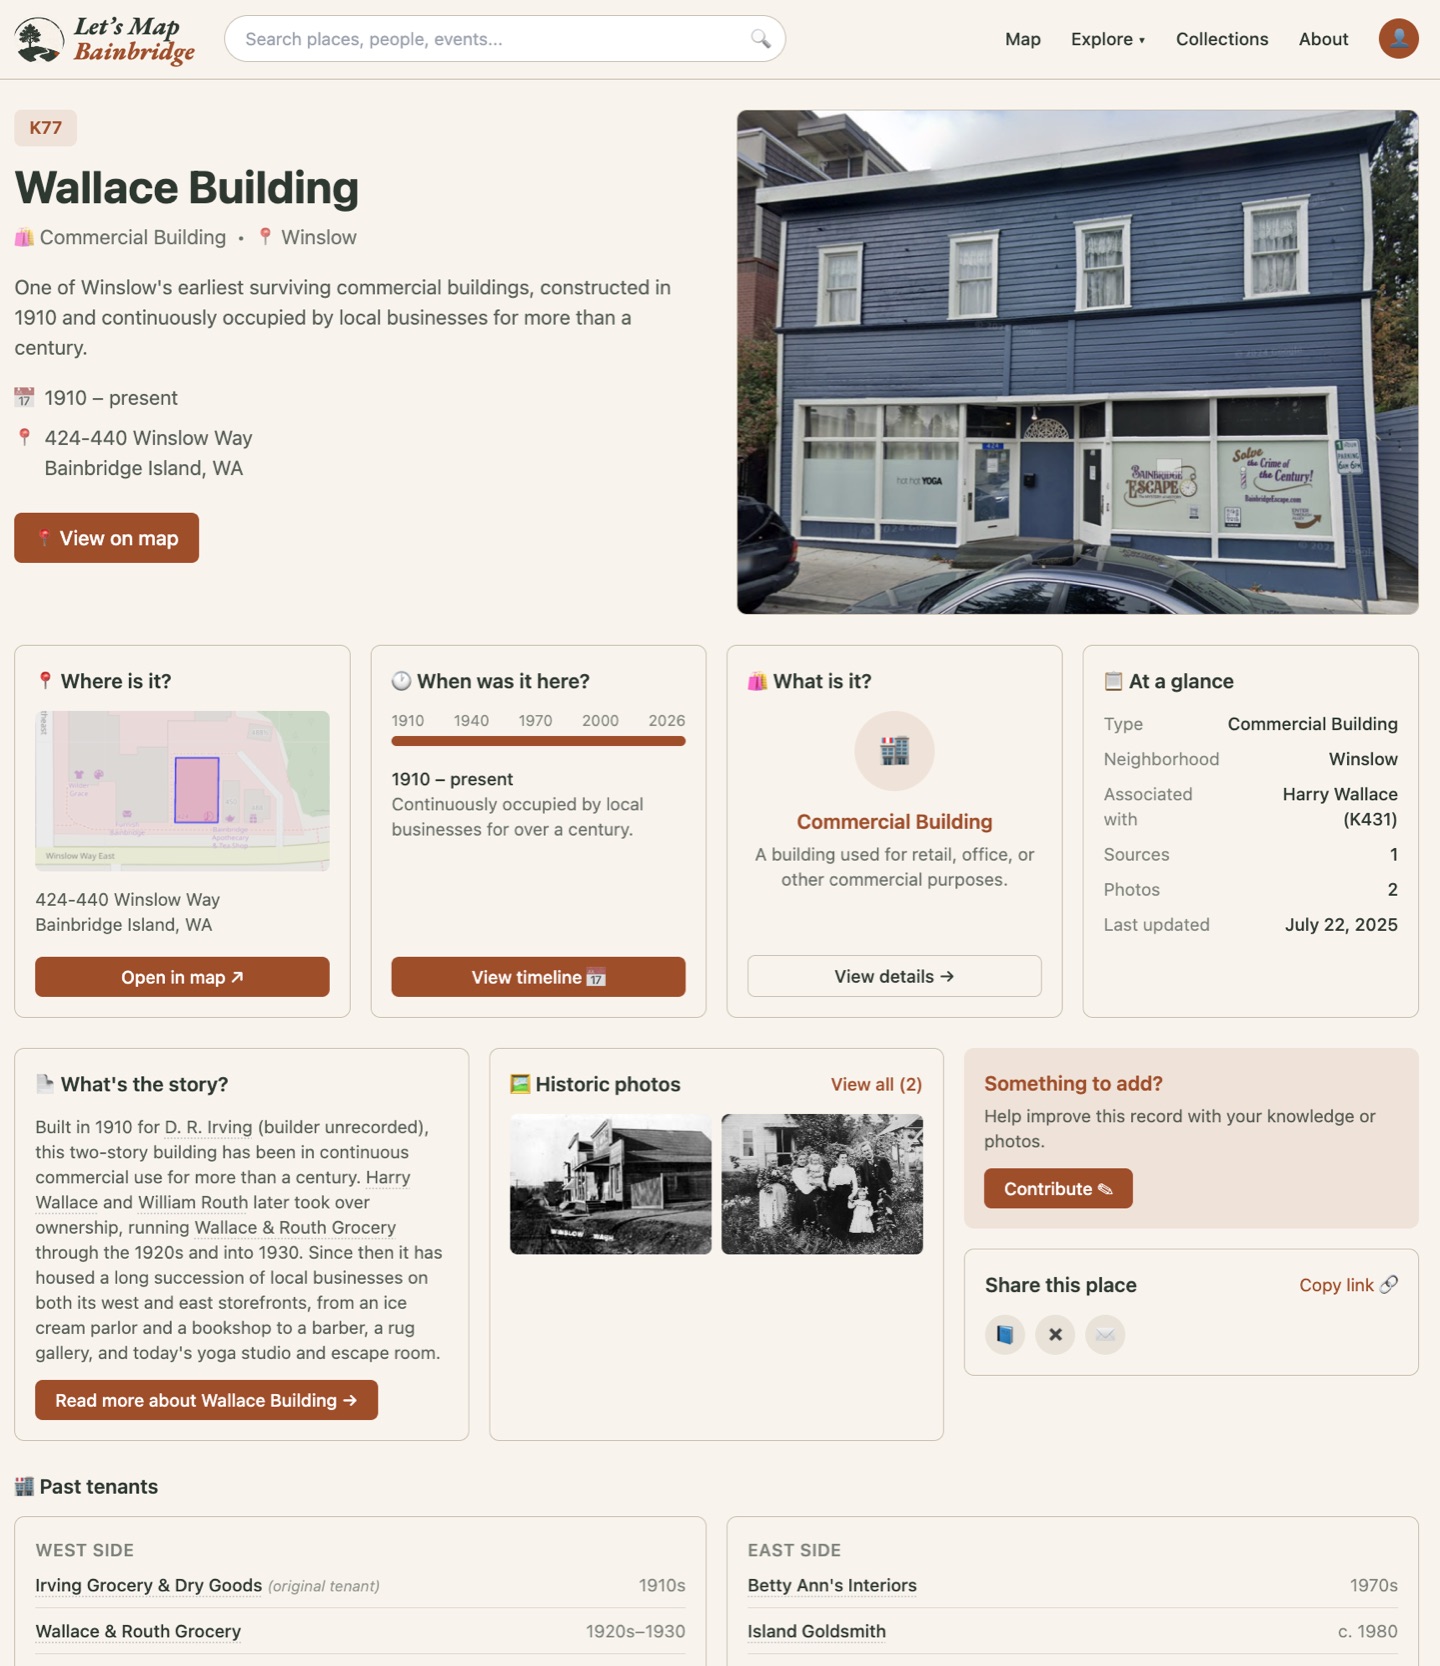
- A knowledge graph of the island. Nearly 4,000 people, places, buildings, organizations, vessels and events, with 1,711 typed relationships between them and 1,541 written, sourced narratives.
- An ontology and a vocabulary. 31 OWL classes and 95 typed properties, informed by CIDOC CRM and Linked Art; a 955-concept SKOS vocabulary, 699 of its concepts crosswalked to the Getty Art & Architecture Thesaurus and 164 mapped to OpenStreetMap tags.
- A hybrid store. PostgreSQL and PostGIS for geometry and fixed-shape data; Apache Jena Fuseki for the RDF graph; projections running in both directions.
- Pipelines that keep it all in step. 14 Dagster jobs, chained by sensors, rebuild every derived product: the RDF projections, Wikidata enrichment, the search index, map styles and tiles, ontology documentation, link checks and backups.
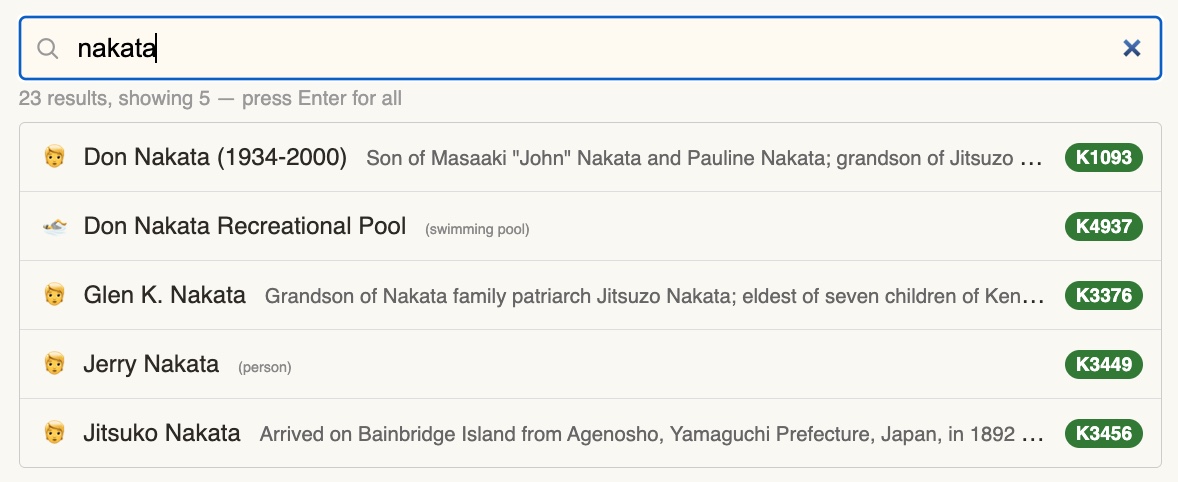
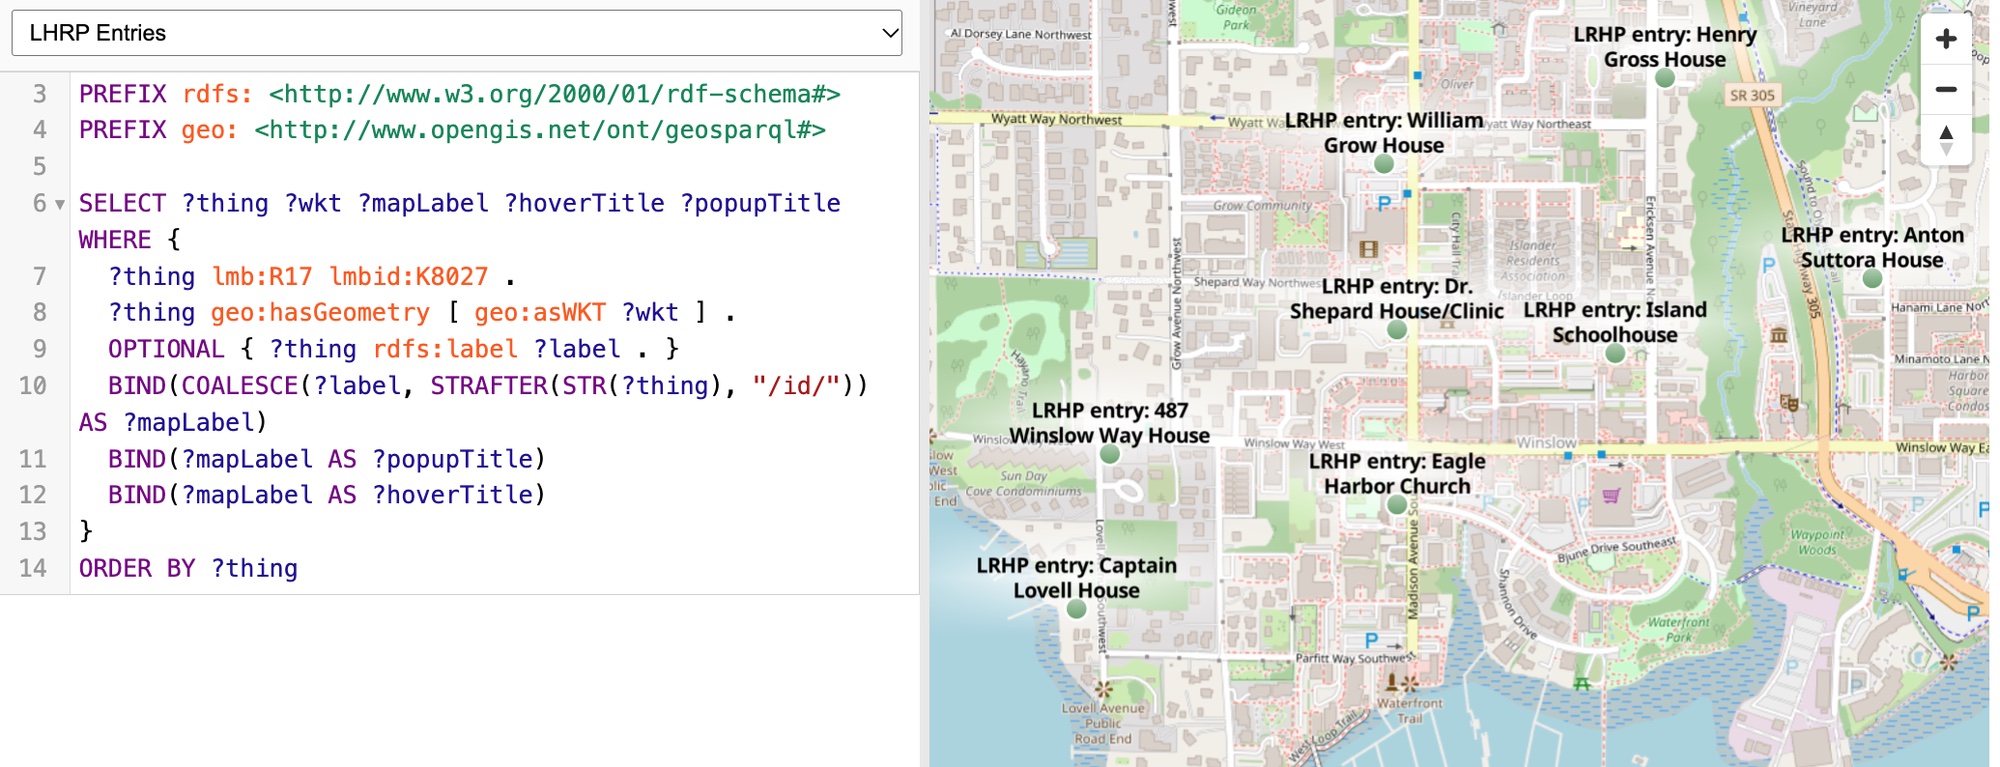
- Ways in. A search box with its own small query language (a Lark grammar compiled to SQL, with type filters that follow the vocabulary hierarchy); a MapLibre map over PostGIS vector tiles; a SPARQL explorer that plots any geometry it finds; and OGC WFS for ArcGIS users through GeoServer.
- Links outward. Things are crosswalked to OpenStreetMap (497), Washington’s historic-property inventory (287), Wikidata (222) and OpenHistoricalMap.
How I built it
I work with an AI coding agent as a collaborator, not an autopilot. Every area of the system has a written design document that the agent reads before changing it; repeatable procedures, such as adding a person or merging duplicates, are written down as 60 codified skills; and custom MCP servers give the agent safe, read-only access to the graph, the pipelines, QGIS and my research library. The agent’s database access is read-only, enforced by the database itself; writes go through confirmation. Documentation is updated in the same session as the code.
It runs on my own infrastructure: Proxmox and Docker at home, a PostgreSQL streaming replica at Hetzner, a three-node Garage object store, self-hosted CI, and Prometheus and Grafana for monitoring.
Results so far
- A private alpha with three volunteers, and data from the City of Bainbridge Island and the Bainbridge History Museum.
- About 6,700 City-supplied addresses imported into OpenStreetMap, incrementally and checked.
- Around 1,800 commits across ten repositories.
- A talk at CUGOS, the Cascadia Urban GIS Open Source group, on 21 October 2026.
What’s next
A data-quality suite (seven layers of checks, with findings shaped like SHACL validation results), a new read API and front end, and opening more of the graph to the public.
More on the project at letsmapbainbridge.org and in my blog posts Getting fonts onto the map and the tech that runs Let’s Map Bainbridge.